Lecture 6: Unified Ecology
This material must be reviewed by BCB743 students in Week 1 of Quantitative Ecology.
Please see the BDC334 Lecture Transcript for the main content of all lectures.
This lecture is incomplete – other sections in this lecture series has the material you want; for example, see Lab 4.
Univariate diversity measures such as Simpson and Shannon diversity have already been prepared from species tables, and we have also calculated measures of
Let’s shine the spotlight to additional views on ecological structures and the ecological processes that structure the communities—sometimes we will see reference to ‘community or species formation processes’ to offer mechanistic views on how species come to be arranged into communities (the aforementioned turnover and nestedness-resultant
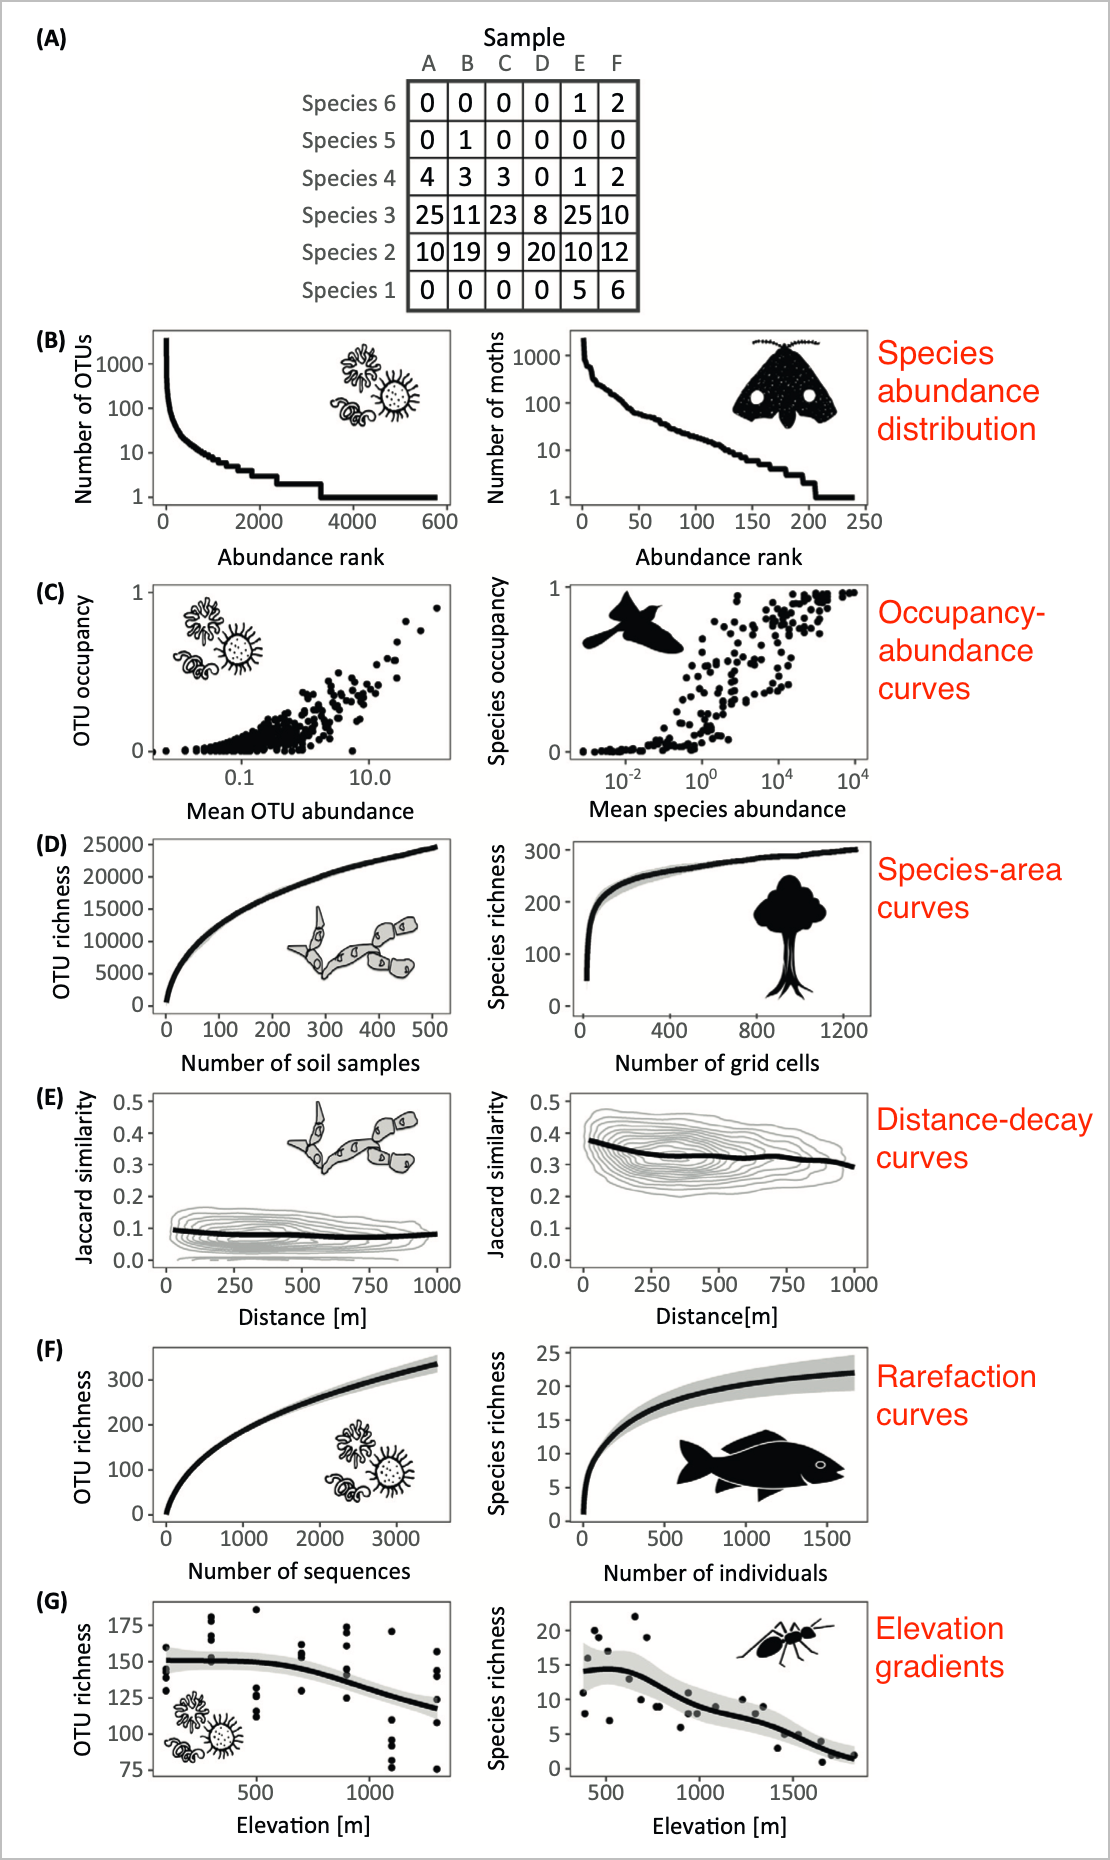
You will already be familiar with the paper by Shade et al. (2018). Several kinds of ecological patterns are mentioned in the paper, and they can be derived from a species table with abundance data (but not presence-absence data!). The patterns that can be derived from such a table include (see Figure 1 below), and they are as follows:
- Species-abundance distribution
- Occupancy-abundance curves
- Species-area curves
- Rarefaction curves
- Distance-decay curves
- Elevation gradients
References
Reuse
Citation
@online{smit,_a._j.2024,
  author = {Smit, A. J.,},
  title = {Lecture 6: {Unified} {Ecology}},
  date = {2024-07-22},
  url = {http://tangledbank.netlify.app/BDC334/Lec-06-unified-ecology.html},
  langid = {en}
}

